![]()
Fleet Tracking *NEW*Trailer Tracking Fleet Management
|
Fleet Tracking *NEW*Trailer Tracking Fleet Management |

All Browsers/OS Supported more...
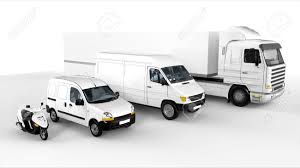
From Bikes to HGVs
CANBUS Fuel & Distance more... |
General These samples are not comprehensive. Aside form the built in reports all data can be exported for user processing.
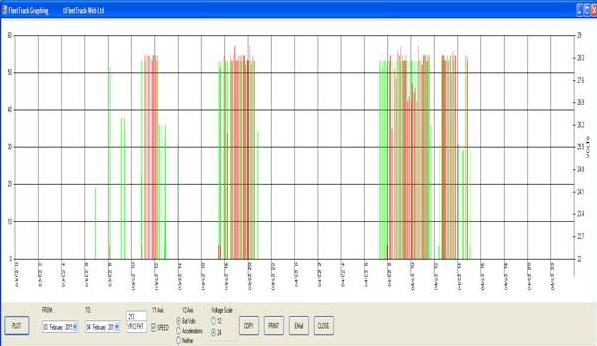
Graph of vehicle usage. A linear graph of Time of Day V Speed can be generated. This allows activity to be seen at a glance. Number of journeys estimated, plus journey breaks and speed profiles.
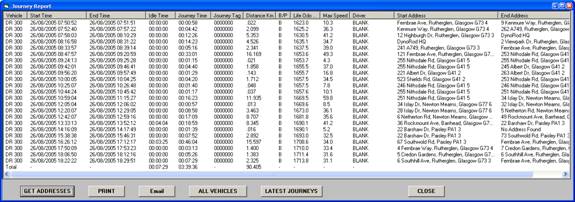
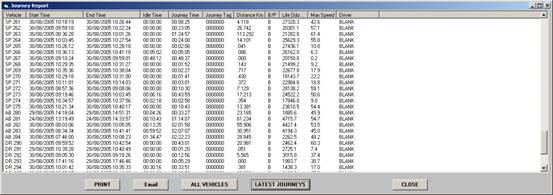
Journey Report. Every Journey can be extracted and displayed along with distances and speeds. The start and end address of each segment can also be displayed.
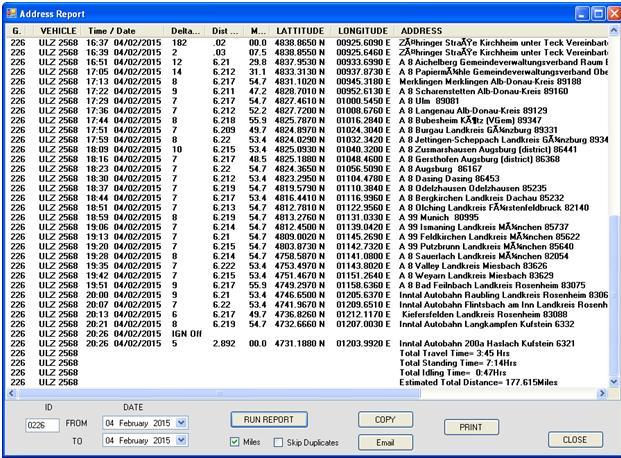
Address Report. A report showing the speed and position of every logged position can be generated for fine analysis.
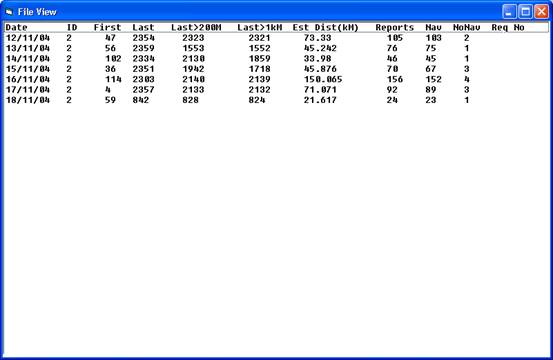
Fleet Analysis. A report can be generated to show when every vehicle in a fleet first reported last reported. Last moved more than a trivial distance. The number of times that the vehicle reported and if navigation was achieved. This is used to confirm to insurers that a vehicle was not used between certain hours for premium reduction, Spot unauthorised out of hours use, Check if the system operated correctly and identify any attempts to disable the tracking. Out of hours use can also be set to trigger an automatic SMS alarm message. The report can be for a range of vehicles on one day or for one vehicle over a range of days. The latter is shown.
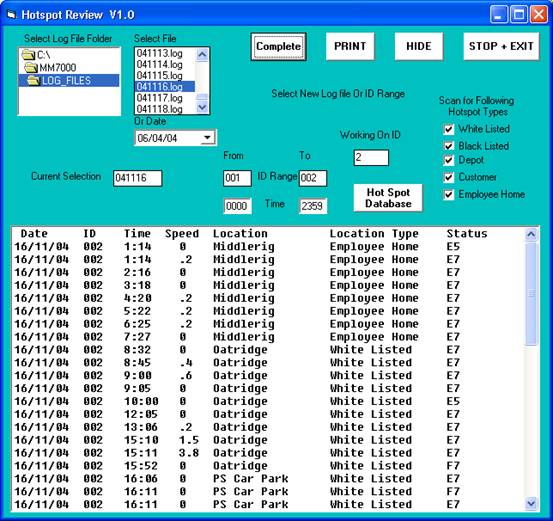
Hotspot Report. Map locations can be defined as Hotspots with just a few clicks. These are in 5 classifications: White, Black, Depot, Customer and Home. A report can be run on any or all types to see if a vehicle was at any of the locations. This can be used to see if an employee went home at lunchtime, visited a blacklisted betting shop, failed to go to a depot or customer etc.
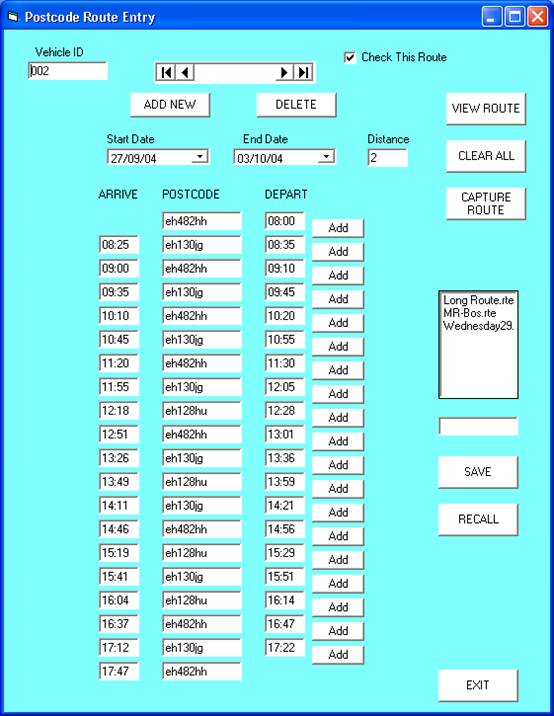
Routing Report. A route can be generated for a vehicle by either specifying a list of postcodes or by clicking on the map. This route can then be checked in real-time as the vehicle travels or later as a replay. An alarm is generated if a deviation occurs. This allows deviations from optimal routes to be detected and corrected before fuel and time are wasted. Other uses have been checking that road gritters follow the planned route. Security vans make no deviations and vehicles collecting ballot boxes are not deviated.
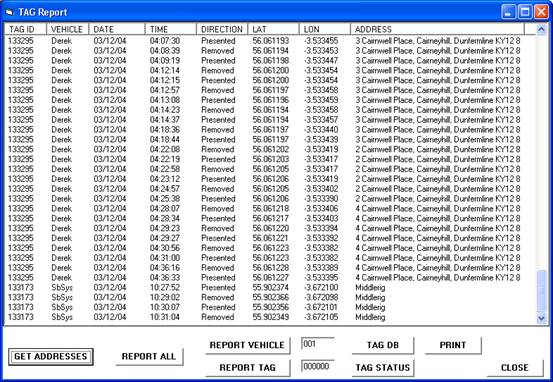
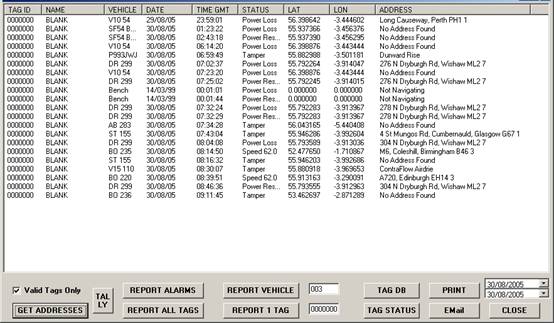
TAG Report Gives the position and time of every ID tag event. Can be referenced by Vehicle ID or by Tag ID.
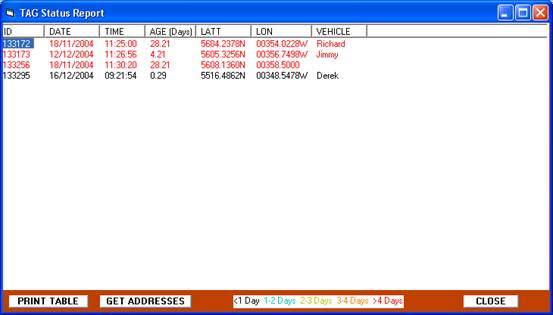
TAG Status ReportLast known position and time of Driver or Asset.
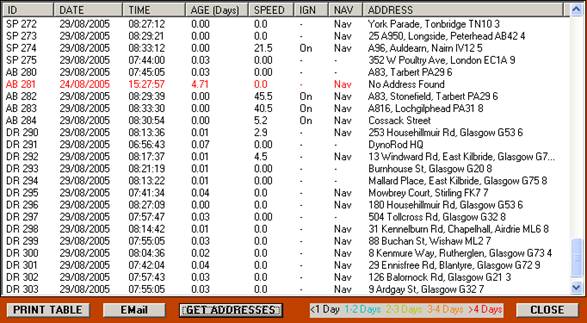
Fleet Status Report The time and position of every vehicles last report can be produced to show that each vehicle is reporting in as expected.
'Nearest To' Report. A list is generated of the distance from a given location on the map, e.g. postcode or a simple click the on map, to every vehicle in the fleet along with Journey times. This allows the user to find the quickest vehicle to a callout or collection/delivery.
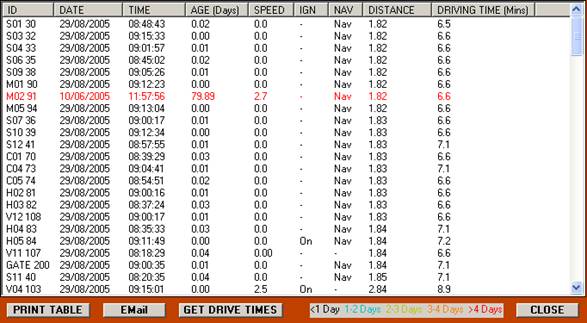
Drive
Time report This
shows, graphically, how far you can travel from a fixed point in a specified
time i.e. 10 mins.
Alarm Report. Shows what and when alarmed
Latest Journey Report This shows that last journey completed by each vehicle
whether it occurred today or not. This provides easy access to the latest
lifetime odometer figures for all vehicles.
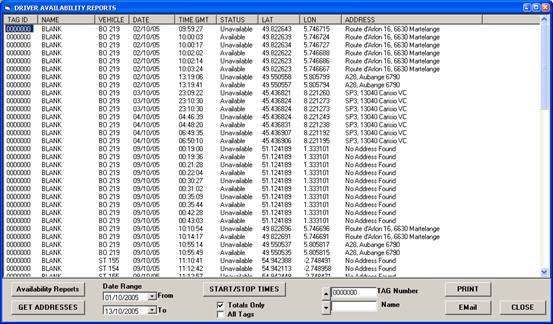
Availability
Report
This shows the periods where the driver has indicated
his availability by pressing a button in the cab. It gives the drivers ID, Name,
Vehicle, Date and time of the beginning of the period and the end of the period.
Lastly the address where this occurred can be requested.
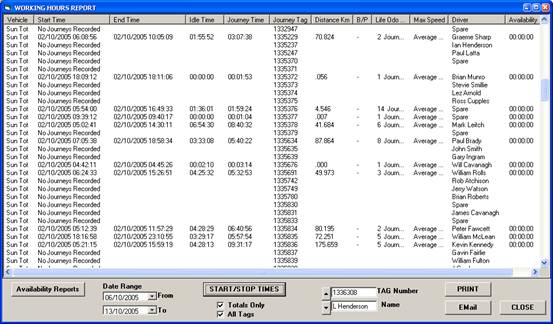
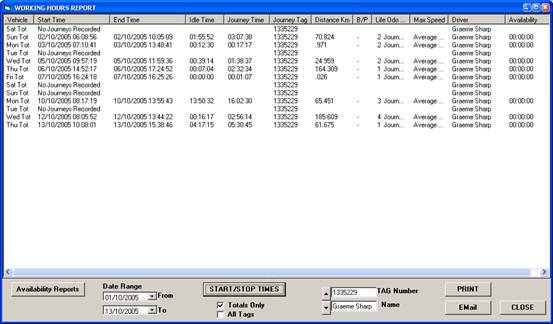
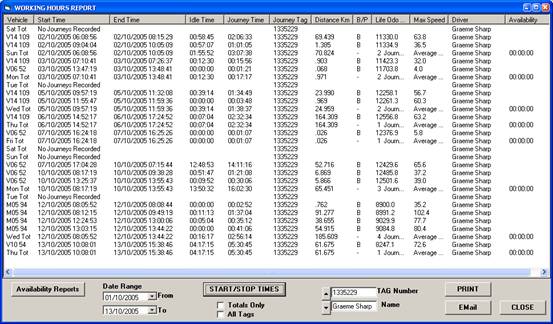
Working Time ReportsThis is produced by the system for a given date range and for each driver ID or for just one driver ID. It shows the first start time, the last stop time, the idle time total, the journey time total, the distance total, number of journeys, average duration, and the total availability time for that driver that day.
Example 1
Example 2
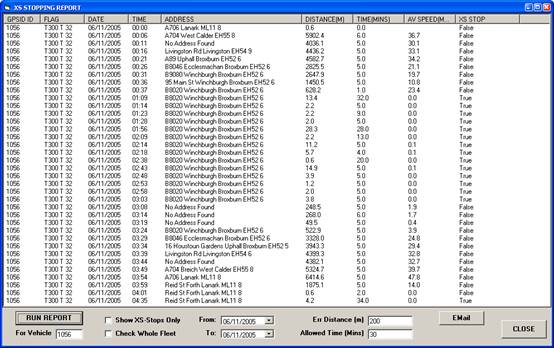
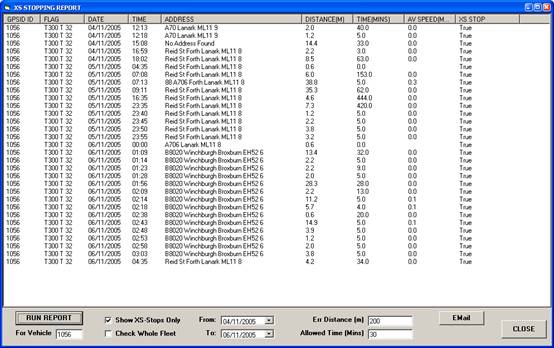
Example3 Excessive Stops Report The system can produce reports to see if vehicles have made excessively long stops during a defined time period. Two parameters are defined by the user. The first, is how long a stop is allowed to be. The second, is a parameter which says how far a vehicle may move between reports before it is considered that a stop is over. For example a vehicle moving forward in a queue to unload will change position several times but the general location will remain the same.
Example 1
Example 2 | 
Trailer Tracking more...
Plant & Tractors |